Campus recruitment metrics: measure the season by who joins, campus by campus
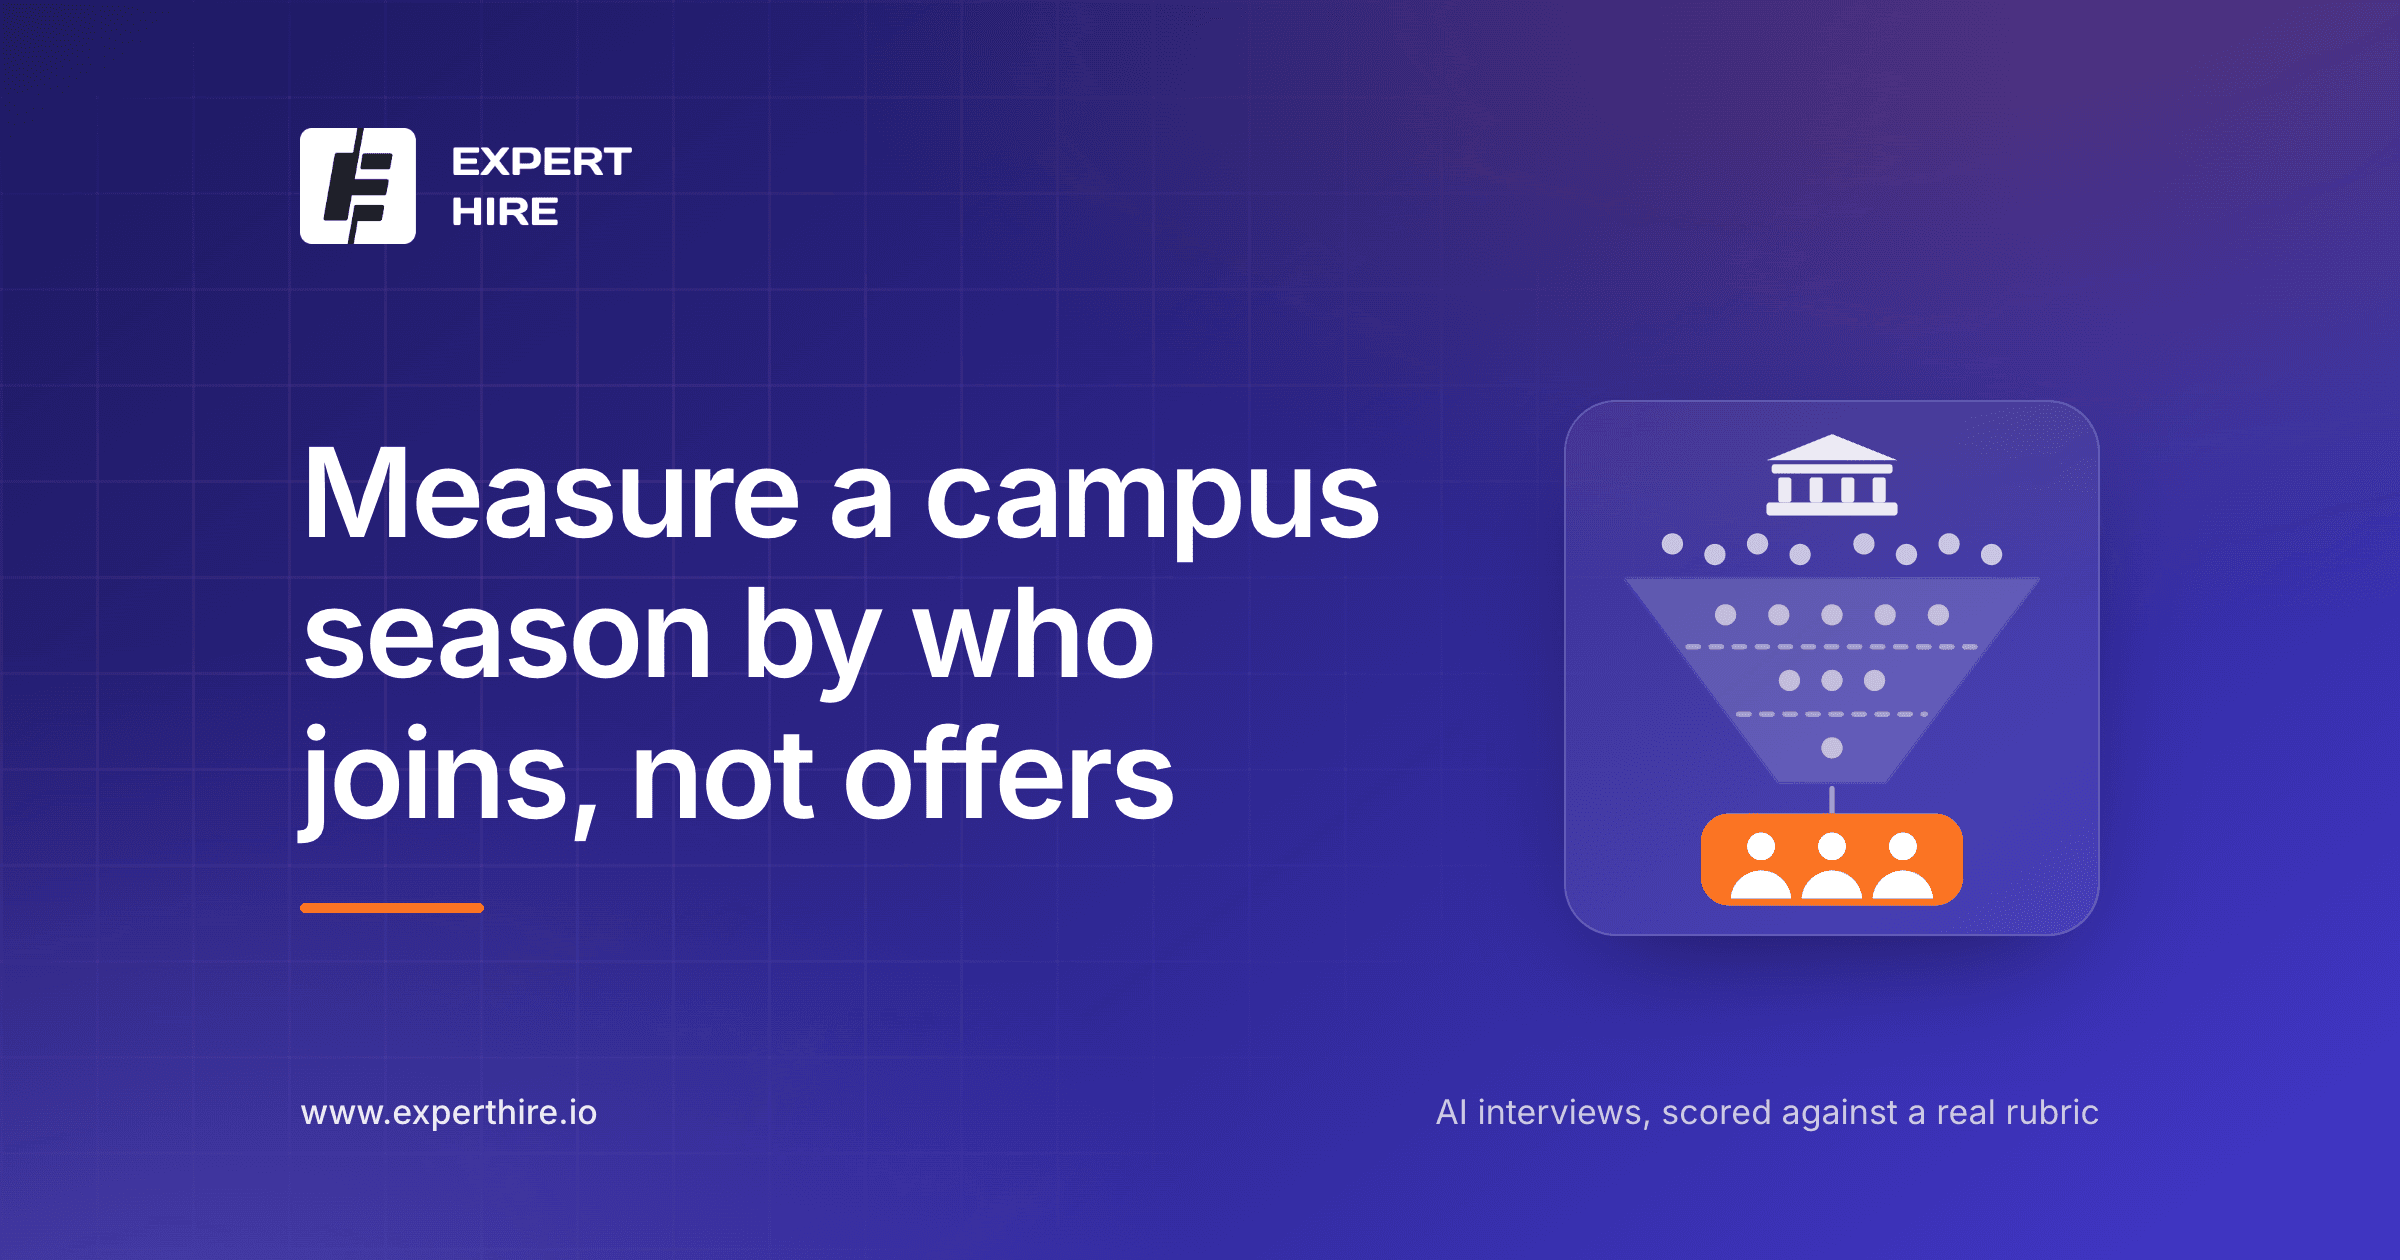
Campus recruitment metrics are the numbers an employer uses to judge a campus hiring season: how many students moved through each stage, how many accepted and joined, how good they turned out to be, and what each joiner cost. Many teams track offers made and stop there. That's too early, because in campus hiring the months between offer and joining are where a season is won or lost.
This guide cuts the usual long list down to seven metrics in three layers, each with a formula and a data source, covering every stage of the campus recruitment process. It's written for campus relations leads and TA teams who have to report on a season and plan the next one.
Key Takeaways
Our position: measure a campus season by who joins and how they do, campus by campus, not by offers made.
Seven metrics are enough: stage pass-through, first-round completion, offer acceptance, renege rate, joining rate, quality of hire by campus, and cost per joiner.
US benchmarks from NACE's 2024 report: about 75% of offers accepted and about 7% of accepted offers reneged. Use them as reference points, not targets.
You can only compare campuses on quality if every campus was scored on the same rubric.
Count the season's cost against joiners, not offers. An offer that never turns into a joiner still cost you money.
Why most campus recruitment metrics stop too early
Look at a typical list of campus recruiting metrics and you'll find a dozen or more: time to fill, source of hire, applicant ratio, offer acceptance, cost per hire and so on. They're not wrong, but they share two problems.
First, there's no hierarchy. A team tracking fourteen numbers can't tell which three actually explain a bad season. Second, most lists end at offer acceptance. In campus hiring an accepted offer can sit for months before the student joins, and students keep looking in that time.
So we group campus hiring metrics into three layers: the funnel before the offer, conversion after the offer, and quality and cost. Every metric is cut per campus, because a season-wide average hides the campus that's dragging it down.
Funnel metrics: pass-through and drop-off by stage, per campus
Metric 1: stage pass-through rate. For each campus, count the students at each stage: applied, screened, first round completed, final round, offered. Divide each stage by the one before it. A sharp drop at one stage on one campus tells you where to look.
Metric 2: first-round completion rate. Divide the students who finished the first round by those invited. This matters most when the round is remote. A low completion rate is usually a logistics problem, like a missing app, poor lab Wi-Fi or a confusing invite, not a sign that the students were weak.
Read drop-off honestly. If the first round removes 70% of students on one campus and 30% on another, check whether the rubric was the same before you conclude anything about the colleges. If auto-reject thresholds were on, you should be able to trace each drop to a score.
After the offer: acceptance, renege and joining rates
Metric 3: offer acceptance rate. Accepted offers divided by offers made. NACE's 2024 Recruiting Compensation Report found US employers made offers to about 54% of Class of 2023 candidates, and 75% of those offers were accepted. That's US data, so treat it as a reference point for India, not a target.
Metric 4: renege rate. Accepted offers that the student later declined, divided by accepted offers. The same NACE report put it at about 7% of accepted offers. The 2025 Recruiting Benchmarks Report noted that reneges rose for full-time roles, possibly linked to employers delaying offers.
Metric 5: joining rate. Students who joined divided by students who accepted. This is the number that tells you whether the season delivered headcount. Keep reneges (the student withdrew) separate from revoked offers (you withdrew), because they mean different things and have different fixes.
Placement cells track joining from their side too, and our guide on running a campus placement drive explains how colleges report it. If your joining count and the college's don't match, find out why before you report either.
Quality of hire by campus (and why it needs one rubric)
Metric 6: quality of hire by campus. Compare each joiner's first-round score with a later outcome, like their probation result or first performance review. Then group by campus. Over two or three seasons, you'll see which campuses produce people who do well in your roles, not just people who interview well.
This only works with one rubric. If each campus was assessed by whoever was free that week, the scores aren't comparable, and neither are the campuses. If your campus hiring solution can't score every campus on the same rubric, this metric can't be computed.
Compare within one role, too. A score for a backend role and a score for an analyst role measure different things. For the broader method, our post on quality of hire covers how to define it and which outcomes to use.
Cost per joiner and time to decision
Metric 7: cost per joiner. Total season cost divided by the number of students who joined. Include travel, campus fees, assessment tools, interviewer hours and the time your team spent, and use the same count when you weigh campus vs lateral hiring. This is the honest version of cost per hire for campus hiring, because dividing by offers flatters a season where many students never joined.
Track time to decision alongside it, from a student's first interview to your offer or rejection. NACE's 2025 report put that at 27.3 days on average for US employers. A strong student who waits that long has time to accept somewhere else. Our post on how to reduce time to hire has practical ways to shorten it.
Where the data comes from: report cards, the pipeline board and the placement cell
Good campus recruitment KPIs need clean sources. Here's where each layer usually comes from.
Stage counts come from your ATS or hiring platform. On Expert Hire, the ATS pipeline board shows a column per stage with a live count, and a stalled stage shows up as a column that never empties. The board filters by role, client and date range, and you can export the view as you've filtered it.
The filter bar covers role, client and a date range, not campus, so keep each student's campus in your own export or tracking sheet to build the per-campus funnel.
Scores come from report cards. Each round produces a report card with a skill breakdown weighted against the JD, plus the recording and transcript. Scores are meant to be compared within a job, which is exactly what quality by campus needs. Our guide on how to read a candidate report shows what each report contains, and reports never cost credits.
Auto-advance and auto-reject thresholds are off by default. If you turn them on, every automated decision still has a scored report behind it, so there's no black-box pass/fail and every drop in the funnel can be traced.
Joining and later outcomes come from your HR system and the placement cell. Placement cells that use Expert Hire see their own students' funnel from the college's side. That's their data for their reporting, so agree what you'll share with each cell directly.
A one-page season scorecard
At the end of the season, fill in these lines for each campus and for the season as a whole:
Students applied, screened, completed the first round, reached the final round, offered.
Stage pass-through rate at each step, and the first-round completion rate.
Offer acceptance rate.
Renege rate, with revoked offers listed separately.
Joining rate.
Average first-round score of joiners, and later their probation or review outcome.
Total season cost and cost per joiner.
Average days from first interview to decision.
One sentence: keep, change or drop this campus next season, and why.
That last line is the point of the exercise. The numbers exist to change next year's campus list, rubrics and timelines.
Frequently asked questions
What are the KPIs for campus recruitment?
The most useful ones are stage pass-through rate, first-round completion rate, offer acceptance rate, renege rate, joining rate, quality of hire by campus, and cost per joiner. Cut each one by campus. Time from first interview to decision is a useful extra, because slow decisions push up reneges.
What are some examples of campus recruiting metrics?
Examples include the share of applicants who complete the first round, the share of offers accepted, the share of accepted offers that turn into joiners, and the total season cost divided by joiners. A quality metric compares joiners' interview scores with their later performance, grouped by campus.
What is a good offer acceptance rate for campus hiring?
There's no universal target. NACE's 2024 US data found employers had 75% of their offers to Class of 2023 candidates accepted. Use that as a reference point, not a benchmark for India, and compare your own campuses against each other and against your previous seasons.
What is a renege, and how do you measure the renege rate?
A renege is when a student accepts your offer and later withdraws, usually for another offer. Measure it as reneged offers divided by accepted offers, per campus. Keep reneges separate from offers your company revoked, because the causes and fixes are different.
How do you measure quality of hire for freshers?
Compare each fresher's first-round score with a later outcome, like their probation result or first performance review. Group the results by campus and role. This only works if every campus was scored on the same rubric, so set that up before the season starts.
The bottom line
Campus recruitment metrics should tell you which campuses gave you good people who actually joined, and what each of them cost. Track seven metrics in three layers, cut every one by campus, and count joiners rather than offers. Most importantly, score every campus on the same rubric, or the quality comparison falls apart.
If you want to see the evidence each round produces for that comparison, see how the Expert Hire AI interview platform builds a report card for every candidate.
By TK, Growth at Expert Hire. Last updated October 21, 2026. Reviewed by Anand Suresh, CPO at Expert Hire.
Ready to Transform Your Hiring?
Start your free trial to see how Expert Hire can help you screen candidates faster and smarter.